
(2 PM – promoted by TheMomCat)
 Over the balance of this year, you are likely to hear more and more about our broken Highway Funding system. For instance, William Moore, of the consultancy group Vianovo and member of the Transportation Transformation Group, wrote at Infra Insight this last 13 March that:
Absent swift action by Congress, state departments of transportation will begin to have cash flow problems that could delay payments to vendors and slow projects. Without action by the fall, new projects may have to be shelved until Congress can resolve the funding crisis that confronts the Highway Trust Fund.
However, this is just the most visible layer of pending crisis in our highway funding system. Even if we were to fix the threat to engage in spending at status quo levels,status quo spending has been falling behind the damage done by cars and trucks to our roads for decades, and even if we were to fund our transportation to address the massive shortfall in maintaining our current highway system, we have not seriously begun in addressing the fact that our current transport system is one of our principle contributor’s to our economy’s present climate change suicide course.
We have a trebly broken highway funding system, and there is no guarantee that we will actually address the simplest of the problems.
The good news is that we do not need massive technological breakthroughs to fix this triple layer cake of crisis. The bad news is that what we do need is a political movement with both the focus and the clout to push the existing available solutions onto the table, in the face of determined status quo resistance … and those who have at least glanced at our political system over the past decade would be aware that building such a movement is a “to be solved by reader” kind of problem.
The Road Funding Crisis You Will Hear About: The Highway Trust Fund
 The nature of the road funding crisis that you will hear about is straightforward. We have federal fuel taxes that pay into the Highway and Transit trust funds, and then projects and other funding are approved that draws upon those trust funds. Back in the 90’s, when we last set the rates of Federal gas and diesel taxes, they were set in nominal terms without an inflation index.
So every year, the federal gasoline tax rate of 18.4 cents per gallon and the federal diesel tax rate of 24.4 cents per gallon sees a reduction in the real tax burden on motorists and truck freight … slower, when inflation is slow, and faster when inflation is fast, but, from the CAP fact sheet on the issue:
- In inflation-adjusted terms, the gas tax is worth only 11.5 cents today.
- In 1993, the gas tax represented 18 percent of the cost of an average gallon of gasoline. Today, it represents only 5 percent.
- If gas and diesel taxes had been indexed to keep pace with inflation, today they would be 29 cents and 38 cents per gallon, respectively.
But the ongoing, slow and hidden cuts in fuel taxes, year after year and decade after decade, is only half of the story. After all, if the indexing was the only problem, then the funds could be restored by simply enacting an “index plus”, such as adding 0.1 cents plus an index correction each quarter, until the gas tax caught up to its original value of 29 cents a gallon in 2014 dollar.
The gas tax never actually covered any part of the costs of burning gasoline, which as we now know includes not just the pollution of dumping poisons into our atmosphere, but also includes the more insidious but, it turns out, more dangerous dumping of CO2 into the atmosphere … which is essential to life on our planet, but which in ever increasing concentrations in the atmosphere as we dump millions of years worth of naturally sequestered carbon is highly likely to cause sufficiently severe climate change that it will wreck our ability to have a national economy and national society.
Instead, what the gas tax covered was a fraction of the costs imposed by cars and trucks on public and semi-public right of ways. That damage is done by the vehicle relative to the weight of the vehicle ~ the vehicle axle load and the number of axles ~ and so if vehicles were to become more efficient, then there would be a reduction in the gas tax per passenger mile (for cars) and per ton-mile (for trucks) even if we were to restore fuel tax levels in real terms. And that is, indeed, the fourth point in the Center for American Progress dot points:
- The corporate average fuel-economy standards will rise to 54.5 miles per gallon for cars and light-duty trucks by model year 2025. This will approximately double the efficiency of vehicles compared to current levels and dramatically reduce the amount of tax revenue flowing to the HTF, crippling federal surface transportation programs.
To make things still worse, a large part of the electorate harbors the fantasy that gas taxes “pay” for the costs of roads, when the reality is, as Washington Cycle points out:
There are several analyses that show that “user fees” – such as the gas tax, tolls and vehicle taxes and fees – cover only about 50-60% of road costs. The Brookings Institute, 2003, 58.9%; Subsidy Scope, 2007, 51%; The FHWA, 1999, between 72% and 22%]. The remainder comes from other taxes and fees, property taxes and borrowing. So non-motorists do pay into the building of roads. In fact, a study by the Victoria Transport Policy Institute showed that motorists are heavily subsidized by non-motorists.
It is substantially harder to convince social welfare recipients like motorists, engaged in a heavily subsidized activity like driving, that they should pay a larger share of the costs that they impose on society if many of them have been successfully fed the lie (by, among other sources, the self-interested roadbuilding, car, and truck industries) that they are paying their own way.
Further, it doesn’t feel like they are social welfare recipients. They face increasing cost of gasoline due to the rising cost and declining efficiency of petroleum production. They typically face it with stagnant or declining incomes, due to over three decades of neoliberal economic policies pursued by both Republican and Democratic administrations and corporate majorities in both houses of Congress.
The increasing social welfare subsidies that they are receiving on their fair share of road costs have been coming in small dribs and drabs each year, and are only a tiny fraction of the productivity gains that they have had diverted from their paychecks to fuel the income growth of the wealthiest in this country.
Now, mass media in this country has not been shy in focusing on other social welfare subsidies, and ignore the background fact that the standard of living of the recipients of those subsidies have been declining. But that is typically for some group that is outside the target demographic. In this case, it is the majority who is receiving these social welfare subsidies, so mass media is far more interested in what the majority feels like is happening. They have little interest in hammering home inconvenient truths which they would be happy to hammer home if it offered some “other” to blame outside of their target demographic.
So that is the first layer of the highway funding crisis … which is the easiest layer of the crisis to solve. Mind, that is a relative comparison. Its not easy to solve, and we could well end up failing to solve it. But its not as hard to solve within the status quo system as the other layers of our crisis layer cake.
The Road Crisis You May Or May Not Hear About: The Infrastructure Funding Crisis
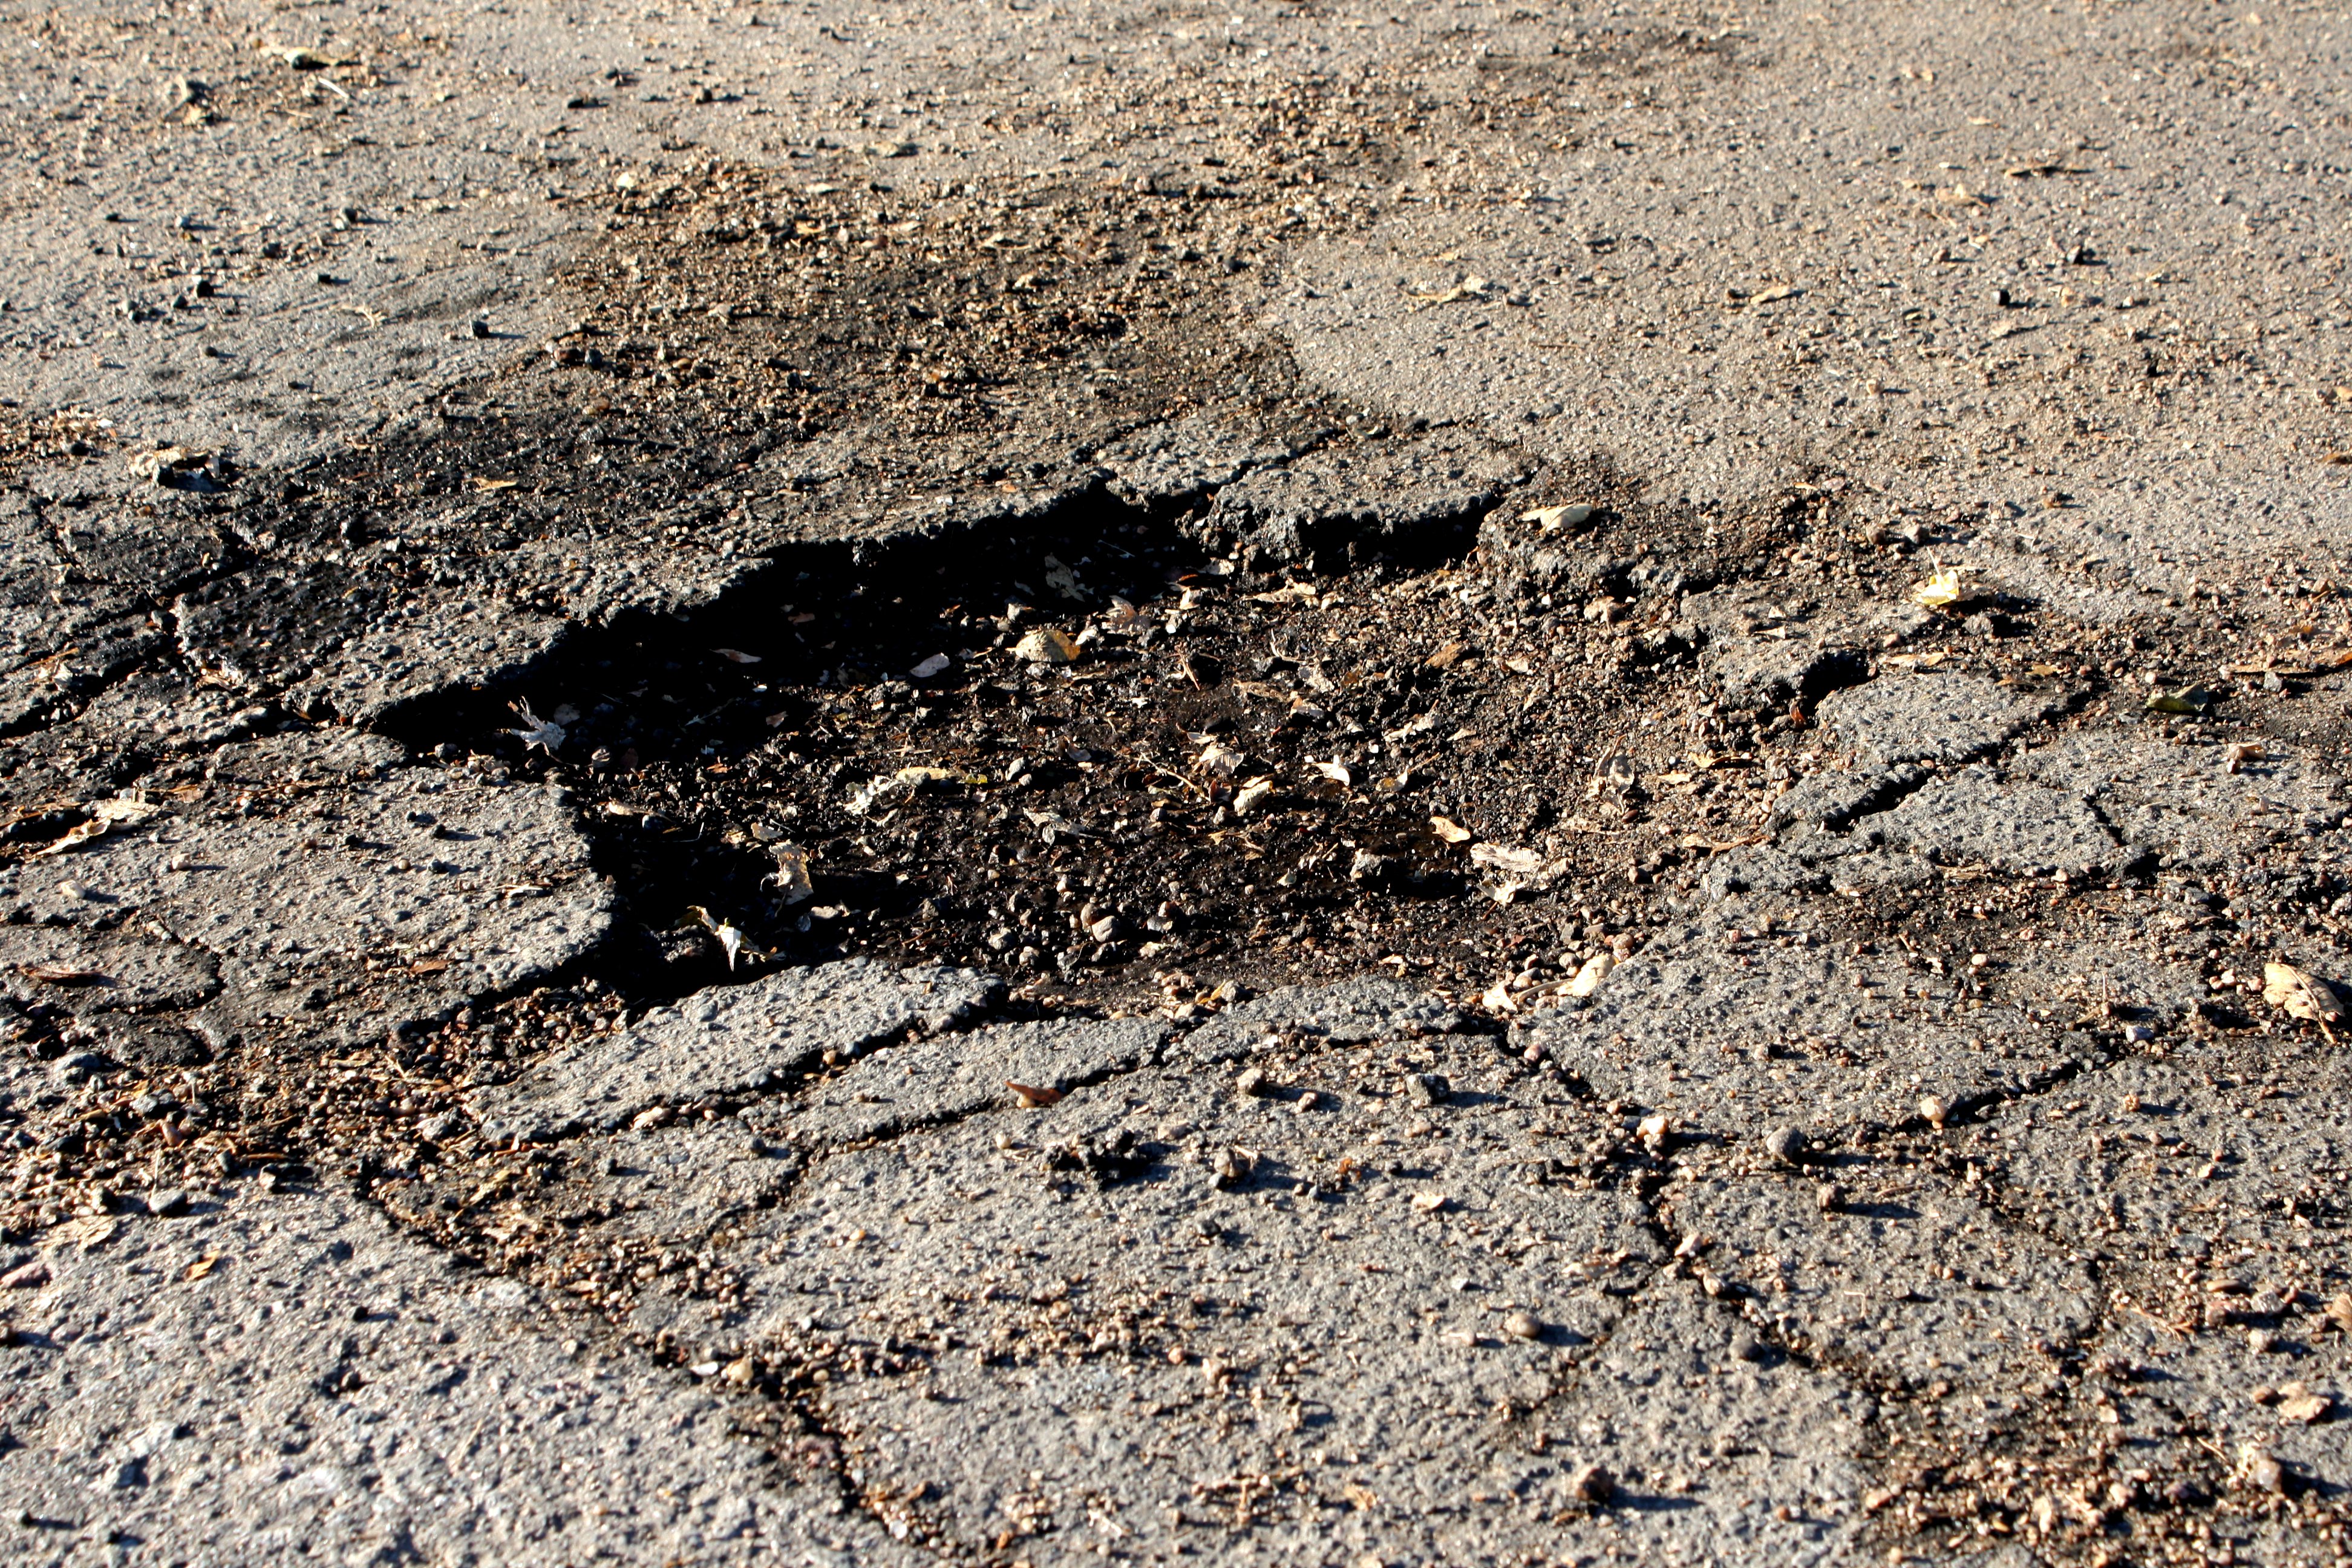 The 21st of March marked the one year anniversary of the release of the American Society of Civil Engineers Infrastructure Report Card, in which Roads received a grade of D, meaning “The infrastructure is in poor to fair condition and mostly below standard, with many elements approaching the end of their service life. A large portion of the system exhibits significant deterioration. Condition and capacity are of significant concern with strong risk of failure.”
Focusing on their report on Roads: Investment and Funding:
Estimates state that to maintain all of the nation’s highways at their current condition would cost $101 billion in annual capital investment between 2008 and 2028. In order to improve the nation’s highways, investment would need to rise to $170 billion annually, or an additional $79 billion annually from current investments, during that same time period. Of that $170 billion, $85 billion would need to be directed toward improving the physical condition of existing assets in order to achieve the Department of Transportation’s State of Good Repair benchmark. This investment would bring the number of federal-aid highway vehicle miles traveled on pavements with a good ride quality up from 46% in 2008 to 74% by 2028.
Unfortunately, federal, state, and local governments are only spending $91 billion annually on capital investments, meaning that each year our roads deteriorate further. If present trends continue, the unfunded gap in highway funding, which is 48% of the total need in 2010, is expected to increase to 54% by 2040.
So, even setting aside new road building, maintaining our existing roads while bringing them up to a state of good repair would cost $186b annually. Total spending, including fuel and other motor vehicle user payments and state and local property taxes, sales taxes, and other forms of non-user fees, is on the order of $155b (Streetsblog, 23 Jan 2013). So we are spending a total amount that is less than we would need for a “fix it first” road policy, with no new lane construction at all … about 1/6 of our “fix it first” total is unfunded.
But we do not, of course, have a “fix it first” policy. If our investment in new roads is in proportion to 30% investment in new road capacity in the ASCE wish list, our spending on maintaining our existing roads and bringing them up to a state of good repair would be about $108b, which is less than 60% of the need.
While fuel taxes only cover 50%-60% of road spending, road spending in turn only covers about 60% the cost of the cost imposed on the system by traffic. So fuel taxes actually only cover cover 30%-36% of motor vehicle road road costs.
And this infrastructure spending gap dwarfs the Highway Trust Fund crisis that we shall be hearing about with increasing frequency in the year ahead. The estimate is that we need $15b in annual revenue for the Trust Fund to remain solvent. That is a key part of maintaining the $155b in spending, but it leaves a large majority of the real funding gap untouched … while continuing to make the funding gap worse by including spending on new lane miles.
In short, if we “fix” the first layer of the funding crisis, that still leaves a funding crisis that is two or more times bigger yet to be solved … and with no substantial policy changes, would further deepen the larger funding crisis.
The Funding Crisis You May Rarely Hear Of: Roads and the Climate Crisis
If we were to solve the first and second layer of the transport funding crisis layer cake, we would have roads to drive on in a state of good repair as we headed toward an estimated 6°C (10°F) global warming, likely including crossing three or four quite scary tipping points:
- The tipping point for Amazon dieback is estimated to be near 3-5°C global warming (Lenton et al. 2008; Malhi et al. 2009; Salazar and Nobre 2010). “A collapse would have devastating consequences for biodiversity, the livelihoods of indigenous people, Amazon basin hydrology and water security, nutrient cycling, and other ecosystem services.”
- Ocean ecosystems. Coral reefs will struggle to survive at 1.5 degrees and are projected to experience widespread coral reef mortality at 3-4°C above pre-industrial. This will impact hundreds of millions of people economically dependent on reef ecosystems, not to mention the storm surge protection they provide.
- West Antarctic Ice sheet locks up 3 metres of sea level rise, and from research we know it is losing mass and is inherently unstable, but we don’t even have a threshold estimate.
- Greenland Ice Sheet locks up 6-7m of sea level rise and is losing mass. Recent research has estimated a tipping point may be as low as 1.5°C
We cannot assign a marginal cost per ton of CO2 to the impacts of the 10°F average global warming which is our current estimated track, because the structural shifts of climate shocks of that magnitude dwarf marginal changes. Under the status quo track, the most likely outcome for the United States is the collapse of our national economy and society. Therefore, for any sworn officers of the Constitution, preventing this change from occurring is their first priority duty, on the same level as defending the United States from invasion by an enemy determined to destroy the United States as a nation.
What we can do is consider the far from ambitious target of limiting global warming to an average 2°C (3.6°F), and look at what is necessary to accomplish that. As simplified at the 350.org Do The Math blog:
It’s simple math: we can emit 565 more gigatons of carbon dioxide and stay below 2°C of warming – anything more than that risks catastrophe for life on earth. The only problem? Burning the fossil fuel that corporations now have in their reserves would result in emitting 2,795 gigatons of carbon dioxide – five times the safe amount.
 And looking at our CO2 emissions by sector, in order to restrain our own fossil fuel consumption and CO2 emissions to below 20% of what we would emit under our status quo track, we must largely eliminate CO2 emissions from out transportation system.
Figures from the (largely neoliberal) Green Growth Action Alliance of the World Economic Council indicate that on a global scale, economic growth on a catastrophic status quo 10°F track requires $33T (p. 13), and only half of that is investment in transport infrastructure: the other half is investment in vehicles. They further estimate that the incremental investment in vehicles to place the world on a “mere” 3°+F path is greater than 100% the requirement under the status quo.
Scaling their global estimate in proportion to the US funding levels above, that is looking at additional spending on vehicles in excess of $200b/annually, and in addition a substantial share of sustainable, renewable energy investment in excess of $150b/annually, and in addition an indeterminate incremental investment in the transport infrastructure that best supports more sustainable transport systems.
Indeed, just as maintaining the Federal Highway Fund status quo makes the infrastructure gap worse, fulling in all of the infrastructure gap as defined by the American Society of Civil Engineers would make the sustainable transport infrastructure gap worse, since much of that spending would act as a subsidy to continued reliance on transport technologies we cannot afford to rely upon.
It would, however, be a mistake to take the magnitude of the sustainable transport funding gap as an “added cost” add-on to the status quo as the final word on the largest layer of the transport funding crisis layer cake. Because of the way that we heavily subsidize road users, there is substantial inefficiency built into the current system. And if we mine that inefficiency, we can not only scale back the size of some of the sustainable transport funding gap, but take slices out of the first two layers at the same time.
Diesel Road Freight: The Biggest Social Welfare Subsidy in a Road Subsidy System
![]() The examination of whether heavy trucks are paying “their fair share” of road costs are often pursued in terms of the share of costs imposed by trucks and cars, and the share of revenues derived from trucks and cars.
The examination of whether heavy trucks are paying “their fair share” of road costs are often pursued in terms of the share of costs imposed by trucks and cars, and the share of revenues derived from trucks and cars.
But this assumes that the spending on the roads is roughly equivalent to the revenue derived from the road users. If revenue from cars and trucks as a whole are not covering their costs. If we were to fix the funding gap with equal contributions from the demand side and supply alone, we would have to reduce demand by 20% (a 20% reduction of 100% of costs imposed) and increase revenues by 33% (20% added to the 60% of costs actually funded).
When we look at the various recipients of road welfare, one stands out as a particularly egregious. That is long distance trucking. The reason it is particularly egregious is that there is existing technology which can transport long distance freight at under 10% the energy consumption: electric freight rail. The road subsidy that we provide to long distance trucking is sufficiently large to ensure that we do not have the “critical mass” of demand to drive private railways to invest in electric freight rail …
… which means that the road cost which we cannot find a way to fund is also creating a large additional and economically unnecessary energy cost, including spending on oil imports instead of domestic economic activity in an economy in the later stages of a Depression, and carbon emissions which survival of our nation demands we find a way to avoid.
According to the 2013 Oregon Highway Cost Allocation study (pdf), which is in several respects generous to trucking, trucking accounts for about 35% of highway costs, and a similar share of highway use taxes and fees. According to the Bureau of Transportation Statistics, in 2002, long haul shipments, of 250 miles or more, carried 82% of ton-miles, and very long haul transport, shipments in excess of 1000 miles, represented 32% of ton miles. While these figures are from a decade ago, at the time longer distance shipments were growing faster than short distance shipments, so they are reasonable figures to use.
Therefore, a Steel Interstate system which carried a quarter of the current road shipments of 250 miles to 1,000 miles, and half of current road shipments in excess of 1,000 miles, would account for about a quarter of current road freight ton miles … and about 9% of total road costs.
A Steel Interstate system which carried half the current road shipments of 250 miles to 1,000 miles, and three quarters of the current road shipments in excess of 1,000 miles, would account for about 44% of road freight ton miles … and about 15% of total road costs.
So under a strategy of splitting the road transport funding gap 50:50 between reducing the costs imposed on roads and increasing the funding to cover those costs, the Steel Interstate policy on its own could cover anywhere from half to three quarters of the required demand reduction.
Or to put it in more immediate terms for automobile road users, replacing the demand reduction available from a serious Steel Interstate policy with road funding instead would require an increment equal to 15% to 25% of our current spending on road infrastructure … on top of the 33% of our current spending on road infrastructure to cover half of the gap.
Under our current road funding system, motorists aren’t spending that money on maintaining roads … instead, as the American Society of Civil Enginers, they are spending a greater amount between what is spent on fixing cars, and what is spent reconstructing roads. So that 15% to 25% increment on road costs understates the savings available to motorists and all tax payers from full scale adoption of a Steel Interstate policy.
Conclusions and Considerations
As always, any topic in sustainable transport is on-topic in the Sunday Train. So feel free to talk about CO2 emissions reduction, energy independence, suburban retrofit and reversing the cancer of sprawl over our diverse ecosystems, or the latest iPhone or Android app to map you bike ride. Whatever.
And on this particular topic, what policy would you support that would help use reduce our unfunded use of our decaying road network?
The Sunday Train doesn’t really leave the station until you jump in and join the conversation so … All Aboard!
1 comment
Author