
(4 pm. – promoted by ek hornbeck)
 The topic for this week’s Sunday Train was brought to my mind when I listened to the Energy Gang podcast. They were discussing the question of whether “CSP (that is, concentrated thermal solar power) is dead”, and the always entertaining, but not uniformly informative, “energy futurist” Jigar Shah declared that “CSP is dead” (segment starts 30:29), backing the claim up with a set of bullet points that fell far short of supporting the claim. And listening to the set of bullet points, it seemed to me that he was talking in the context of the phase of the transition to renewable energy that we are presently in, and ignoring the phase of the transition that we will have to pass through if we are to survive as a national economy and national economy.
In short, he seemed to be talking more as an energy presentist than an energy futurist, claiming that there was no plausible position for solar CSP power based on both the technology currently rolled out for a technology that is experiencing rapid development, and on context of renewable energy being added to an energy system which is untenable over the long term.
But I do not mean to single out Jigar Shah, since as I have recently been exploring various discussion spaces talking about various issues in the roll-out of renewable energy, cross-talk between the different phases of the transition to renewable energy seems to be commonplace. So what I wish to write about this Sunday afternoon is the “Two Transitions” to renewable energy: the Current Transition and the Next Transition.
So, why Two Transitions … exactly?
 As far as why two rather than one … I will get to that. As far as why two rather than three, or four, or five … that’s because we have, over the past thirty years, stripped out the luxury of three or four or five phase transitions. We have pushed our own backs against the wall, and when we are able to wrest energy policy from the Suicide Club, we will have to pursue a Pedal to the Metal transition of our energy system, at the same time as we are pursuing a Pedal to the Metal transition of many of the activities we currently power with our energy system.
So at the maximum, if the transition we are currently pushing falls short of 100% very low GreenHouse Gas (GHG) emission energy, we then have to at that point begin the transition to 100% very low GHG energy. Its either one transitions or two. In the 90’s, and maybe into the first decade at the turn of the century, we might have had the luxury of three transitions. But no more.
Why Two rather than One? That starts to get into the meat of the present essay.
We have a range of sustainable energy technologies that, with the correct supporting policies in place, can be rapidly rolled out into the energy system that we presently have. And doing so will certainly replace energy supplies that presently entail a substantial amount of GHG emissions.
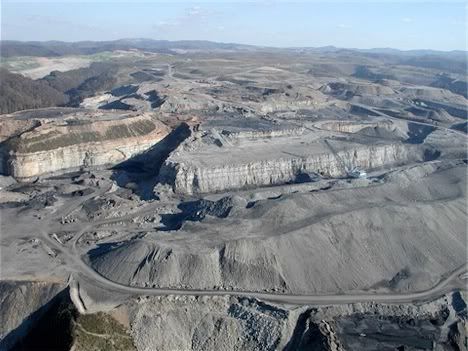
Indeed, if we pursue the most economically efficient options, we will in the course of The Current Transition completely retire a large amount of generating capacity fueled by some of the worse GHG emission culprits. We have in our technical grasp the retirement of almost all of our fossil coal fired generating capacity, in less than a decade, if we would only stop providing coal users the massive subsidy in kind of not charging them for the full economic costs it imposes on the economy and ecosystem that it is embedded within.
However, killing off Coal is not sufficient. We also need to kick our addiction to the other primary Suicide Club fuel, Natural Gas.
And the economics of Natural Gas power generation means that it is harder to accomplish the needed killing of Natural Gas power generation than Coal power generation. Indeed, while renewable power that we can introduce into our current energy system could kill off Coal power plants …
… what is presently killing off Coal Power generating capacity is that as Coal Power plants reach the end of their useful life, they are being replaced by Natural Gas generation. Independent of the empirical question whether Natural Gas is or is not as bad a GHG emitter as mineral coal … it is inarguably a major GHG emitter. We need to restrain our combustion of existing fossil fuel reserves to 20% or less of what is at hand, and there is no reason to believe we will complete This Renewable Transition without already having burned through a major part of that.
So by the time This Renewable Transition is completed, even on the most optimistic timeline and outcome, we will have at best killed off mineral coal but will have likely only made a dent in natural gas consumption, and will be in a position where we have to move to a net 0% GHG emissions.
Effective Generating Capacity versus Nameplate Capacity
 Since this discussion revolves around the pursuit of 100% of our power from renewable energy sources, it is important to clarify up-front a common confusion between effective generating capacity and nameplate capacity.
You may have seen headlines over the past year about a majority of new capacity coming from renewable energy resources. Indeed, because of the way that the timing of new generating capacity is brought online, in many months, renewable energy is a large majority of new generating capacity brought online, as ThinkProgress reported regarding November 2013. However, as they noted at that time:
There is, however, a difference between capacity and actual electricity generation: capacity is the total amount of energy that can be produced, whereas generation is the total amount that is produced. Because renewables produce energy less of the time than other resources with the same amount of capacity, these two numbers can sometimes vary significantly.
This is something that propaganda by members of the Suicide Club tries to seize on to confuse the unwary. The economics of the situation is straightforward. You could design a wind turbine so that collection of wind farms across a wind resource would, when taken together, generate an average of 70%-80% of its nameplate maximum capacity. That would involve specializing the wind turbines to be most effective when operating in relatively light wind conditions, and feathering them to produce at 100% of their capacity during stronger wind conditions.
However, doing that would mean throwing away a majority of the energy available from the wind.
So if you have wind turbines like that, it would make economic sense to increase the generating capacity of the wind turbines, increase the transmission capacity of the electricity distribution, and operate the wind turbines so that they can harvest more power from strong wind conditions. You’d get twice as much energy or more, for a fairly modest amount of extra money.
Now, the fact that there is a variable amount of energy contained in the wind implies that effective harvest of that energy will also be variable. And variable generation means that the average generating capacity over the course of the year is substantially below 50%.
However, when we look at levelized cost of renewable energy sources, we are looking at their cost per kilowatt hour delivered, so the fact that effective generating capacity of some renewable energy source may be 10%, 30% or 50% of total nameplace capacity is beside the point when talking about the cost per kilowatt hour of windpower.
The ratio of effective generating capacity to nameplate capacity is called the “capacity factor”, and Climate Suicide Club propagandists often try to get the unwary to thing, “aha! its capacity factor is only 33%, so its real cost is 3 times higher”. The “aha” is, of course, entirely bogus. The cost of windpower is based on its effective generating capacity, so the “capacity factor” ~ the ratio of effective generating capacity to nameplate capacity ~ is a red herring as far as energy cost calculations go.
Looking at the EIA numbers (which themselves are past-bound and do not reflect state of the art technology), the levelized cost of various renewable energy sources are based on effective generating capacity, not on nameplate capacity (select Climate Suicide Club options in italics for reference):
- $47.9/MWh geothermal (92%)
- $64.4/MWh advanced combined cycle natural gas (87%)
- $80.3/MWh onshore windpower (35%)
- $84.5/MWh hydro (53%)
- $95.6/MWh conventional coal (85%)
- $102.6b/MWh biomass (83%)
- $103.8/MWh advanced combustion turbine natural gas (30%)
- $130.0/MWh solar PV (25%)
- $204.1/MWh offshore windpower (37%)
- $243.1/MWh solar thermal (20%)
And note that these values overstate the levelized costs of most of the renewable energy sources included and massively understate the true economic cost of the Climate Suicide Club energy sources.
As noted by Amory Lovins in debunking a flawed analysis by a Brooking Institute external fellow (page linking to pdf), we have wind-farms being built on the basis of power purchasing agreements as low as $20/MWh in the northern Great Plains, and grid scale solar PV being built on the basis of power purchasing agreements below $50/MWh in Texas.
The reasons for power purchasing agreements so far below the estimated levelized costs being able to get the harvesting equipment installed at a profit are straightforward. First, new investment is being done with new technology, while the historical track record includes wind turbines and solar PV panels that are substantially less efficient than the current state of the art. Second, the focus of new investment is in the highest quality resource areas. There are wind farms in the Northern Great Plains with effective generating capacity that is 40% to 50% as high as their nameplate capacity. With the EIA estimate based on a 35% capacity factor, a windfarm with a 45% capacity factor has equipment costs per MWh that are more than 20% cheaper than the EIA estimates.
And of course, because we can clearly not release over 20% of the fossil fuels we already have in reserve, the full economic cost of coal and natural gas is whatever price is sufficient to prevent us from using it. Rather than capacity factor, the critical piece of information we need for the conventional coal, advanced combined cycle natural gas, and advanced combustion turbine natural gas plants is how many tons of CO2 per MWh, so we can compute how high to set the carbon price to rule building any more capacity to do something that we are going to have to stop doing (or else risk catastrophic climate change severe enough to render financial analyses moot, since the economic system within which it is embedded will be brought down in ruins).
This Initial Transition to 50% Renewable Power
So, in that context, what is “This Initial Transition” to 50% Renewable Power?
In this initial transition, we pursue any and all incentives we can get through either Congress or State Legislatures to encourage the continued roll-out of renewable energy into our existing energy system.
“This Initial Transition” includes visions such as the American Wind Energy Association site, 20% Windpower by 2030. That timeline objective is actually rather modest compared to our need, but the percentage objective is not just chosen to sound “substantial but reasonable”. That name of that site is repeating the title of a US Department of Energy report by the National Renewable Energy Laboratory (NREL) that not only is it feasible to power 20% of the US electricity supply from windpower, but that the US grid can integrate 20% windpower based on existing hydropower capacity and targeted investment in new transmission capacity.
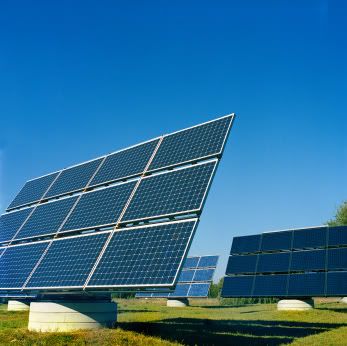
But that is Windpower alone. Since NREL that report was released in July of 2008, not only have the efficiency and capacity factors of Wind Turbines continued to improve, but there have been complementary improvements in solar power. In those six years, the per panel cost of solar PV has continued to drop, while their efficiency has continued to increase, resulting in a rapid decline in cost per MWh.
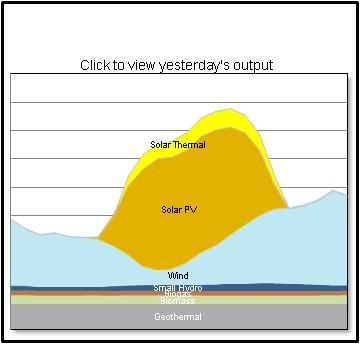 The figure to the right is taken from the 16 August 2014 renewable power generation of the California Independent System Operator (CAISO). This chart omits legacy large hydro power resources and renewable power imported from out of state, which themselves primarily legacy large hydro power resources. You can see that the bulk of the “new” renewable energy produced in California is solar and wind (there is also substantial additional renewable power consumed in California that is imported from out of state, a substantial share of it Pacific Northwest hydropower).
You can see that geothermal, biomass and biogas generating capacity are essentially produced continuously. The modest amount of new small hydropower increases modestly during the the day and declines modestly at night. Much of that fluctuation is because of conduit power which harvests energy from water passing through conduit on its way to its final use, where water use is greater during the day.
Sitting on top of those relatively stable supplies are the big swings of solar and wind. And you will notice something: when wind is strong, as it was yesterday, it tends to be strongest at night. This very common with onshore wind, that the highest wind energy available for harvest are often at night.
And, of course, solar PV, which has grown strongly in California in the past six years, is harvested during the day. So that if solar PV and windpower is added together, the variability of the combination is smaller than the variability of both individual parts.
So if we were to add 10% solar PV generating capacity on top of 20% windpower generating capacity … one impact is that we could then integrate more wind with the same dispatchable hydropower supply. Taking that conservatively as 25% windpower, that would bring us to 35% renewable energy from Wind and Solar.
Now, as noted, hydropower is our primary legacy source of renewable energy. EIA figures set hydropower at 7% of total electricity supply. So we are already at 42% of our current electricity supply. And the addition of generating capacity to existing small dams, together with run-of-river hydro (that is, hydropower generation without a reservoir) from both natural streams and existing water conduits can surely add 2%-4% additional electricity supply.
From the NREL factsheet on biogas, the most readily used form of biogas are landfill material, animal wastes, and organic wastes from industrial, commercial and institutional sources. which could provide methane equivalent to 1.35% of our current electricity supply. If anearobic digestion of cellulosic feedstocks are include, a maximum of 12% of our current electricity supply could be generated from biogas methane. If we just focus on the “low hanging fruit”, we might get 2%-4% of our power from biogas.
I will pass over liquid biofuels here, since the chief focus of liquid biofuels ~ both green and dirty ~ is in providing high energy density fuels for transport vehicles. Solid biomass, including true biocoal, is in a sense a rival with Biogas for the use of cellulosic feedstocks, since there is thermodynamic efficiency in converting woody and fiberous biomass feedstocks into biocoal in a sealed environment which allows the exhaust to be captured, managing the pollutants and co-generating heat and power from combustion of the exhaust gas. While development of this resource is not as advanced, with much solid biomass power generation from torrefied wood, which appropriate supporting policies, we could expect to see 2%-4% of our electricity supply from solid biomass.
If we adopt policies which encourage a roll-out of renewable energy in general, it seems likely the roll-out of geothermal power will continue. That currently provides 0.4% of our electricity supply, so 1%-2% seems to me to be a conservative share of electrical power from geothermal.
And I’m already at 49%-54%, without even tapping the least costly of all energy resources, improving the efficiency of our electricity consumption.
A key feature of the This Phase is that we are adding this new capacity while partially idling existing Climate Suicide Club capacity. The marginal cost of the most abundant of these energy resources ~ that is, the incremental cost of adding “the next” Kilowatt Hour to the grid, once the equipment has already been put up ~ is quite low. That means that when those energy sources are available, they push aside the energy sources that must pay for fuel.
The result is to push down the capacity factors of the fossil fuel power plants. If we dig into the economics of coal and natural gas power plants, and look at the “levelized capital cost” part of the energy cost, the dollar build cost per Megawatt Hour at the assumed capacity facto, we can see that this is likely to fall most heavily onto one type of energy:
- $14.3/MWh conventional Combined Cycle (CC) Natural Gas (NG).
- $15.7/MWh advanced CC NG (87%
- $27.3/MWh advanced combustion turbine NG (30%)
- $30.4/MWh advanced CC NG with carbon capture and sequestration (CCS) (87%)
- $40.2/MWh conventional combustion turbine NG (30%)
- $60.0/MWh conventional coal
- $76.1/MWh integrated coal gasification combined cycle (ICGCC)
- $97.8/MWh ICGCC with CCS
That levelized capital cost ladder tells us that you can pay off natural gas capacity more quickly than you can pay off coal capacity. Conventional combustion turbine peaker NG plants used 30% of the time have about 1/3 lower capital cost per MWh generated than conventional coal baseload power plants … which produce a large share of their electricity off-peak, when electricity is less valuable. Conventional combined cycle natural gas plants are less than 1/4 the capital cost of conventional coal fired plant.
So if you are looking at the risk of “someday” not being able to use the generating capacity that you are building … you would build natural gas generating capacity, which can pay off its original capital investment substantially more quickly than coal fired power can.
Now, when a power plant shuts down, it still has to pay for its capital cost. However, as long as it shuts down entirely, it does not have to pay for its fuel cost. And a greater share of the cost of natural gas electricity is the cost of the fuel. A greater share of the cost of coal fired electricity is the cost of the generating plant. That means that natural gas power plants are better able to survive being shut down with increasing frequency because of an increasing supply of renewable power underbidding fossil fuel power plants on hourly and daily markets for electricity supply.
Finally, the life cycle GHG emissions of coal and natural gas is not a settled scientific question. The point at issue is what fugitive emissions of methane are occurring in the process of exploiting natural gas, both in terms of fugitive emissions from hydrofractured natural gas fields and fugitive emissions of methane from (lightly regulated) disposal of wastes from the hydrofracturing process. Methane has a much stronger GHG impact per ton than Carbon Dioxide, so ongoing Methane fugitive emissions could, if they occur at a high enough rate, substantially increase the real GHG impact of consumption of Natural Gas.
However, the release of CO2 as a direct result of combustion of coal and of methane is more straightforward, with natural gas releasing less CO2 in combustion than coal, since methane contains a large component of Hydrogen which combusts as Water Vapor, while combusting steaming coal, is primarily Carbon combustion.
If carbon pricing is imposed based on direct emissions due to the combustion, ignoring GHG impacts during the production process, the result will be to further increase the financial advantage of natural gas over coal.
And as we start looking at the promised salvation of the coal industry, Carbon Capture and Sequestration, the levelized capital cost of the plant per MWh is greater than the levelized total cost of windpower at $80/MWh … which is (as noted above) biased high for the conditions of “This Initial Transition”. And, supposing CCG works at all, also more expensive than Combined Cycle Natural Gas generation with Carbon Capture and Sequestration.
So if we pursue This Initial Transition, to somewhere around 50%-60% total renewable energy (depending on how many efficiency gains we make along the way), the inexorable result is to Kick Coal.
But we are a multi-fossil-fuel addict, and kicking just one is not enough.
The Final Transition to Renewable Power
 In the Sunday Train of 8 November, 2012, The Myth of Baseload Power, I looked at the work of Mark Diesendorf at the Institute for Environmental Studies at the University of New South Wales in Baseload power is a myth: even intermittent renewables will work.
They look at a 100% renewable energy portfolio for Australia, using hour by hour real time energy demand, wind availability, and solar availability data from 2010. They optimize the renewable energy portfolio for least cost and the result is an energy supply system that is:
- 50%-60% windpower
- 15%-20% solar PV
- 15%-20% Concentrated Thermal Solar Power with 15hrs thermal storage
- the balance existing hydro, and gas turbines burning renewable gases or liquids
In the Australian context, which is near to ideal for Concentrated Thermal Solar Power (CSP), for most days during most of the year, cross-haul of power from places with high wind or solar generation to those with less provides a substantial part of the required integration of variable harvest of wind and solar power, and the time shifting available from the CSP in the optimized portfolio provides most of the balance required on most days. It is, in the Australian context, primarily on calm winter evenings following overcast days that the biogas and other biofuel sources are required to provide peaking power demands from gas turbines.
If we were to run the same model for American conditions, we would get different results. We have generally more active geology than Australia, which implies more abundant geothermal energy locations. Suppose that 5% geothermal is a cost-effective investment.
We also have more rugged terrain in both the Rockies and also the Appalachian mountains than Australia, which offers more high quality pumped storage (or, to point to it by value rather than by common name, reverse pumped hydropower), and if we had 10% pumped storage available (in MWh, not in terms of nameplate capacity), we could likely edge up both the windpower by another 5%. In some states solar PV could also be greater, but on the other hand in some states solar PV might be less, so I leave the solar PV at the 15%-20% level.
Meanwhile, on a per capita basis, effective sites for CSP are less common in the United States. On the other hand, we can substantially reduce the effective cost of CSP by sharing the thermal generating plant with another heat source, such as biogas. This reduces the capital cost in two ways: first, each of the heat sources would only have to shoulder a part of the capital cost of the generating plant (including the capital cost of water-efficient indirect dry cooling rather than water-wasting wet cooling); and second, with multiple heat sources and one of them dispatchable, fewer hours of heat store are required, so that the total capital cost to be shared is also smaller.
And, as described in previous Sunday Train discussion of biocoal, biocoal is an effective complement to reservoir hydropower (whether power generation or pumped storage), and particularly in the Eastern US, the US has substantially more biocapacity for the sustainable production of biocoal than Australia.
So we might expect an optimized portfolio for the US to be something like:
- 55%-65% windpower
- 15%-20% solar PV
- 10% reservoir & run of river hydro
- 5% Concentrated thermal Solar Power (CSP)
- 5% biogas
- 5% biocoal
- 5% geothermal
When we compare that to the current portfolio:
- 39% Coal
- 27% Natural Gas
- 19% Nuclear
- 7% Hydropower
- 6% Other Renewables
- 1% Petroleum
- Less than 1% Other Gases
… the main challenge of the Final Renewable Transition will be Kicking Natural Gas. And given a substantial sunk cost in existing generating capacity, that will require tackling the problem of charging Natural Gas the full economic cost of its emission … which is a sufficiently high price so that it stops being used. Whether or not Natural Gas is as bad as coal, or less bad than coal, it is in any event bad, and by the time we are able to start our Final Renewable Transition, we surely will not have anything left in our GHG emissions “budget” to allow any ongoing use of natural gas for electricity supply for the balance of this century.
Now, by design, the exercise that Mark Diesendorf carried out was a Cost-Optimized 100% renewables electricity supply. So he didn’t include nuclear capacity in the mix. However, given about 20% of our electricity supply from nuclear power plants, it seems likely that many of those power plants will continue to operate through to the end of their useful life.
Nuclear and Coal power plants are direct rivals in terms of requiring to generate at a sufficiently high capacity factor to cover their substantial capital costs. Once the Coal Plants have been taken offline, their next most direct rivals are Combined Cycle Natural Gas, which have substantially lower capital costs but substantially higher fuel costs.
One side effect of any carbon price that is sufficient to start the process of allowing us to kick our unhealthy addiction to natural gas will be to reverse the economics that have favored combined cycle natural gas at the expense of nuclear power.
Windpower is cheaper than nuclear power, even on the biased high estimates of the EIA on the levelized cost of windpower, and solar PV is more cost-effective, as more of its power is delivered during the time of day that power is in the greatest demand. However, when it comes to allowing a carbon price to shut down natural gas power plants, our existing legacy nuclear power plants are likely to prove useful in increasing the number of hours in the year that both combined cycle and direct combustion Natural Gas power plants are priced out of the market, and so help push them over the threshold where they are uneconomic to continue to staff and operate.
Conclusions and Conversations
The Sunday Train is not completed when I finish writing the essay … rather, that is the point at which the journey begins.
Of course, the journey into a Electricity Supply system powered by Renewable Energy is one that we have already begun, but we have only made modest progress in the first leg of that two stage journey. In terms of This Initial Transition to Renewable Power, or in terms of That Final Transition to Renewable Power … or, if you wish, both … what do you see as particularly promising source of power in your neck of the woods?
Or, of course, anything else you may wish to discuss regarding sustainable energy or sustainable transport.
1 comment
Author