
(4 PM – promoted by TheMomCat)
A few days ago the BLS released some new employment numbers and as soon as they were released, the spinning began. Bloomberg reported that the new numbers augured well for President Obama’s re-election:
A surge in new jobs last month that held the U.S. unemployment rate to 8.3 percent highlights a strengthening economy that bolsters President Barack Obama as he approaches the November election .
The jobs report “is another plus for the president,” said Stu Rothenberg, editor of the nonpartisan Rothenberg Political Report in Washington.
“These numbers suggest the economy is moving in the right direction,” he said. “It’s likely to make people more optimistic, and that’s always, always good for an incumbent president.”
Amidst all of the spinning, the reality-based community ought to be asking itself, “do these numbers really mean anything?”
It would be good to consider whether the numbers mean anything both in terms of whether they truly reflect the experience of americans in the job market and also to consider whether the growth in employment that they represent in the current context is meaningful in the sense that it represents significant and appropriate progress.
The headline number that gets reported every month by the Bureau of Labor Statistics (BLS) is called the U3 number which is calculated from two seperate surveys, the household survey, otherwise known as the current population survey and the establishment survey. The establishment survey is a sample of jobs as reported by employers and excludes agricultural workers. The household survey includes estimates of the self-employed, farm workers and even workers that don’t get paid, for example, relatives working without pay in a family business. (That’s right, you don’t have to get a paycheck or have a formal contract to be counted as employed.)
The establishment survey is based upon employer reports of the pay period which includes the 12th day of the month. For the establishment survey, if a day laborer isn’t paid on the 12th, then that isn’t counted. If a casually employed worker works one hour in a whole month and that hour is on the 12th, he’s considered employed. The household survey reports results for the week which includes the 12th day of each month. Workers are counted as employed by this survey even when they are absent from their jobs for that entire week, paid or not paid.
The margin of error for the household survey is about 436,000 and for the establishment survey is about 100,000.
The U3 report notably does not represent a number of categories of workers that are reasonably considered unemployed, such as those who have exhausted their unemployment benefits, nor does it represent the struggles of workers who find themselves employed in part-time jobs or, find themselves employed in work that does not represent their training, education or abilities. These numbers say nothing about, for example, recent college graduates who have “played by the rules,” invested heavily in their education and find themselves heavily in irremediable debt to the same financial sector which crashed the economy and destroyed their job prospects.
Since many politicians, pundits, talking heads and bloggers are taking employment numbers as a bellwether for the President’s electoral fortunes, if their political analysis is to be correct then the best employment number to use would be the one that bears the closest relation to how the electorate experiences the employment market.
Considering that the (frequently revised) reports of jobs added or lost by the U3 are often within the margin of error for the surveys and the definition of what is counted as an employed person is a little odd, it makes one wonder if there isn’t a better measure of unemployment available. As it turns out, the BLS has alternative measures available, with U6 being the broadest measure that they offer. The broader U6 includes “people who want and are available for full-time work but have had to settle for a part-time schedule” and those that indicate that “they want and are available for a job and have looked for work sometime in the past 12 months.” The most recent U3 number is 8.3% while the U6 is a much higher 14.9%.
Gallup polls also does an employment survey with a somewhat different methodology than the BLS surveys. Gallup’s poll is not seasonally adjusted, surveys the population 18 and older (while the BLS covers age 16 and over) and the sample size is smaller than BLS’. Gallup’s number this month for its poll that is closest to U3 is 9.0% and the Gallup number for their poll that is closest to U6 is 19.0%.
Given what the various measures on offer include, it appears that the numbers that most closely reflect people’s experiences of the employment market are the U6 numbers or the Gallup survey numbers that count the underemployed, though those don’t reflect how many people are working in inappropriate jobs. Here’s a some BLS data in chart form an article published in the Chronicle of Higher Education that tracks college graduate workers in various non-professional occupations:
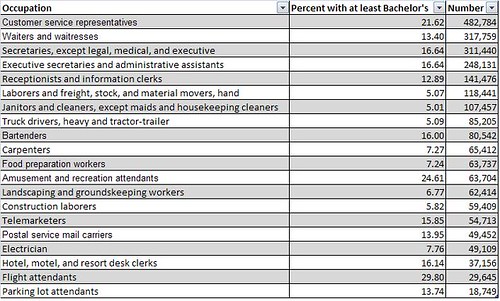
America seems to have a pretty impressively well-educated workforce when nearly 1 in 7 of our parking lot attendants have at least a bachelors degree. On the other hand, it seems more likely that the fact that so many well-educated people are “choosing” to work in occupations where they cannot realize the potential of their education and training is an indicator of low demand for labor.
Here’s an enlightening set of data from the BLS, the employment population ratio:
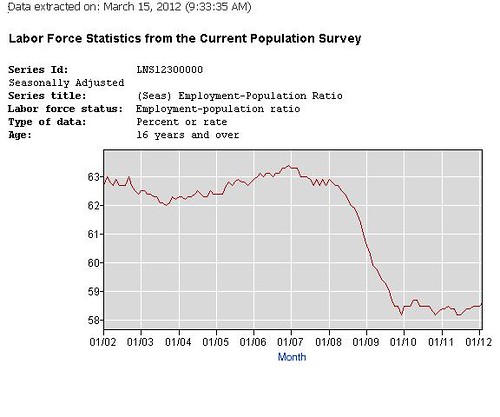
What this chart shows is that the portion of the population that is employed peaked in 2007 at about 63% and suffered a precipitous drop to a little above 58% and has remained around a little above 58% oscillating up and down small amounts since dropping. In light of this evidence, the headline news and the monthly trepidation about the U3 employment numbers are shown to be much ado about nothing. The employment picture is not improving significantly for American workers.
Another demonstration of this lack of significant improvement was highlighted in one of bobswern’s recent diaries at DKos where he quotes a Financial Times article written by 2001 Nobel Prize winning economist, Joseph Siglitz:
This is the inevitable conclusion from looking at the state of the labour market today. It is a shambles. In Friday’s US employment report, the proportion of working-age American adults in a job moved up only 0.1 percentage points, to a miserable 58.6 per cent – numbers not seen since the downturn of the early 1980s. There are still 23m Americans who would like a full-time job but who cannot get one. The jobs deficit, the number of extra jobs that would have been required to keep up with new entrants to the labour market, is 15m. Employment has yet to return to its level of December 2008. Male employment is still below what it was in February 2007 – meanwhile, the working-age population has grown considerably.
Let’s assume that job creation continues at the rate of 225,000 jobs a month. That is only about 100,000 beyond the number required to provide jobs for the average monthly number of new entrants into the labour force. At that pace, it would take 150 months to reach full employment – 13 years, some time around 2025. The independent Congressional Budget Office is more optimistic, forecasting the return of full employment by 2018.
With labour-force growth normally about 1 per cent per year and productivity growth about 2-3 per cent, it takes sustained output growth in excess of 4 per cent to bring unemployment down. No one expects growth at that pace for long enough to return the US economy to full employment any time soon…
Stiglitz underlines why the levels of job growth that are being produced by the Obama administration’s efforts are less than meaningful, how long are unemployed workers supposed to wait for the market to accomodate their need for gainful employment? Given that unemployment benefits run out after 99 weeks, how are workers who have to wait years longer until 2018 or 2025 supposed to hold on?
Progressives do themselves no favors by bandying about cheerful interpretations of meaningless numbers as evidence that their candidate is doing a swell job of making everything good, when the electorate is painfully aware that something is dreadfully amiss. If the progressive message is that government can be a tool wielded by the people to make their lives better, failing to pressure a President publicly supported by progressives to actually produce results utterly negates the message and produces credit in the eyes of the public that as Reagan famously said, “Government is not the solution to our problems; government is the problem.”
If progressives want to do more than win an election (and that is far from secure, even if the disparate groups that make up the liberal coalition all shut up and support the President) then progressives are going to need to find a way to change the conversation and force the President and the Democrats to do the right thing.
Anybody who has taken an economics course can tell you that the supply of labor does not create demand for it, rather demand for goods and services creates jobs. Progressive economists like Paul Krugman and Dean Baker have been at pains to explain to anyone who will listen that we are experiencing a demand shortage and in order to set things right a suitable stimulus plan is going to be required. As Dean Baker put it a while ago:
The first Great Depression was caused not just by mistakes in responding to the financial crises at its onset, but also by the failure to provide a sufficient boost to demand to get the economy back on its feet again. The massive stimulus provided by the second world war that finally restored the economy to full employment could have just as easily occurred in 1931 as 1941, if there had been the political will.
There is nothing magical about war spending that generates jobs. Spending of the same scale on public works, public education and public health would have had the same effect. We know this now, which is why there was never any reason to think that a bad turn of events in the 2008 financial crisis would have condemned us to a decade of double-digit unemployment.
The employment numbers pretty clearly indicate that in order to create meaningful progress in closing the gap in employment created by the destruction of millions of jobs in this recession, further stimulus is required. Fortunately, President Obama is aware of this; unfortunately, he has taken a route to solving the problem that is politically dangerous to the infrastructure that progressives have built up over the years. One of President Obama’s key approaches to creating further stimulus has been to create a tax expenditure that raids the funding for Social Security. The failure of progressives to forcefully defend Social Security, Medicare and the rest of the social safety net from President Obama’s previous, repeated attempts to bargain them away has led to him being able to successfully endanger the future funding of the social safety net:
There is a serious political problem with tying the tax cut to Social Security. While the deal is that the trust fund will be unaffected by the tax cut, the question is what happens when the extension ends. Several Republicans in Congress have already publicly said that they would oppose restoring the payroll tax to its former level, since that would be a tax increase. And increasing taxes is the most deadly sin for many Republicans.
This raises the possibility that Republicans will try to keep the lower Social Security tax rate in place indefinitely. If there was a commitment to permanently replace the program’s shortfall with general revenue, the loss of the payroll tax revenue would not matter. However, there is no such commitment.
Obviously, the Republicans want to reduce Social Security’s revenues so that they can turn the fictional Social Security crisis into a reality. If the program were to permanently lose the revenue from 2 percentage points of the payroll tax, then Social Security would first face a shortfall in a bit more than a decade, rather than the quarter century of full solvency currently projected by the Trustees. And the size of the projected shortfall would be instantly doubled.
Progressives need to step up and challenge the rosy narratives created by candidates who are struggling to get re-elected. If the progressive movement becomes tarred by supporting the people who weaken the social safety net and fail to create meaningful progress on jobs, the progressive movement as a political force is over.
3 comments
Author
have a great day!
Thank you so much for posting this.